Archivo:Sunil Gavaskar Graph.png

Ver la imagen en su resolución original (963 × 492 píxeles; tamaño de archivo: 8 kB; tipo MIME: image/png)
Copied from en:Image:Sunil Gavaskar Graph.png. -- Sundar 04:49, 28 February 2006 (UTC)
Resumen
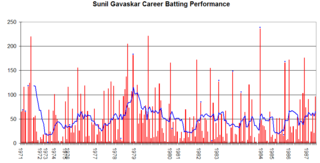
"This graph details the Test Match performance of Sunil Gavaskar. It was created by Raven4x4x. The red bars indicate the player's test match innings, while the blue line shows the average of the ten most recent innings at that point. Note that this average cannot be calculated for the first nine innings. The blue dots indicate innings in which Gavaskar finished not-out.
This graph was generated with Microsoft Excel 2002, using data from Cricinfo and Howstat.com.au."
Licencia
| Yo, el titular de los derechos de autor de esta obra, lo libero al dominio público. Esto aplica en todo el mundo. En algunos países esto puede no ser legalmente factible; si ello ocurriese: Concedo a cualquier persona el derecho de usar este trabajo para cualquier propósito, sin ningún tipo de condición al menos que éstas sean requeridas por la ley. |
Historial del archivo
Haz clic sobre una fecha y hora para ver el archivo tal como apareció en ese momento.
| Fecha y hora | Miniatura | Dimensiones | Usuario | Comentario | |
|---|---|---|---|---|---|
| actual | 04:48 28 feb 2006 | | 963 × 492 (8 kB) | Sundar | This graph details the Test Match performance of Sunil Gavaskar. It was created by Raven4x4x. The red bars indicate the player's test match innings, while the blue line shows the average of the t |
Usos del archivo
La siguiente página usa este archivo:
Uso global del archivo
Las wikis siguientes utilizan este archivo:
- Uso en en.wikipedia.org
- Uso en kn.wikipedia.org
- Uso en mr.wikipedia.org
- Uso en ta.wikipedia.org