Archivo:Europe WattPerCapita animated sequence 1992-2014.gif

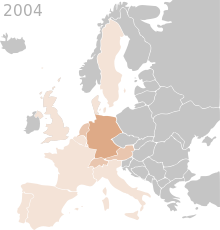
Europe_WattPerCapita_animated_sequence_1992-2014.gif (401 × 420 píxeles; tamaño de archivo: 497 kB; tipo MIME: image/gif, bucleado, 29 frames, 35s)

Resumen

Descripción
English: Animation of European growth of photovoltaics in watts per person since 1992. This is the cumulative capacity of domestic solar PV installations divided by the country's population by the end of each year. Provisional slide for year 2015 is not yet included. Capacity per capita is given in watt-peak (Wp/capita).
 <0.1 watt or unknown
   0.1–1 watt per inhabitant
   1–10 watts per inhabitant
  10–50 watts per inhabitant
  50–100 watts per inhabitant
 100–150 watts per inhabitant
 150–200 watts per inhabitant
 200–300 watts per inhabitant
 300–450 watts per inhabitant
 450–600 watts per inhabitant
Fecha
Fuente

Trabajo propio. Sources

  • EPIA, IEA-PVPS, PV Barometer
  • For detailed figures see file description for each of the listed slides below
  • alternative sources citations used in in growth of photovoltaics and country specific articles
 
Este GIF gráfico fue creado con GIMP.
Autor Rfassbind
Otras versiones

Single frames used to create animated GIF.

  • Single frames/ yearly slides listed below.
  • Interval of animated GIF set to 1200ms.
  • Before animation, SVG images were converted into PNGs and had their transparency removed.
  • Duration 6x for final year of sequence.
  • Looped indefinitely.
MapEuropeSmall WattPerCapita 1992
MapEuropeSmall WattPerCapita 1993
MapEuropeSmall WattPerCapita 1994
MapEuropeSmall WattPerCapita 1995
MapEuropeSmall WattPerCapita 1996
MapEuropeSmall WattPerCapita 1997
MapEuropeSmall WattPerCapita 1998
MapEuropeSmall WattPerCapita 1999
MapEuropeSmall WattPerCapita 2000
MapEuropeSmall WattPerCapita 2001
MapEuropeSmall WattPerCapita 2002
MapEuropeSmall WattPerCapita 2003
MapEuropeSmall WattPerCapita 2004
MapEuropeSmall WattPerCapita 2005
MapEuropeSmall WattPerCapita 2006
MapEuropeSmall WattPerCapita 2007
MapEuropeSmall WattPerCapita 2008
MapEuropeSmall WattPerCapita 2009
MapEuropeSmall WattPerCapita 2010
MapEuropeSmall WattPerCapita 2011
MapEuropeSmall WattPerCapita 2012
MapEuropeSmall WattPerCapita 2013
MapEuropeSmall WattPerCapita 2014
Early, very tentative estimate of 2015 (working version).

Licencia

Public domain Yo, el titular de los derechos de autor de esta obra, lo libero al dominio público. Esto aplica en todo el mundo.
En algunos países esto puede no ser legalmente factible; si ello ocurriese:
Concedo a cualquier persona el derecho de usar este trabajo para cualquier propósito, sin ningún tipo de condición al menos que éstas sean requeridas por la ley.

Leyendas

Añade una explicación corta acerca de lo que representa este archivo

Elementos representados en este archivo

representa a

Historial del archivo

Haz clic sobre una fecha y hora para ver el archivo tal como apareció en ese momento.

Fecha y horaMiniaturaDimensionesUsuarioComentario
actual11:42 7 may 2015Miniatura de la versión del 11:42 7 may 2015401 × 420 (497 kB)Rfassbindincluding map of 2014 (version: all slides as of May 7, 2015)
00:20 30 ago 2014Miniatura de la versión del 00:20 30 ago 2014332 × 348 (358 kB)Rfassbindextended time displayed for last frame (2013) by a factor of four (4 duplicated layers)
16:38 15 jul 2014Miniatura de la versión del 16:38 15 jul 2014332 × 348 (299 kB)Rfassbindcolor fixes for countiresː DEN, SWE, TUR, UKR, for years 1993-2005, 2009-2011, and 2013.
07:03 15 jul 2014Miniatura de la versión del 07:03 15 jul 2014332 × 348 (297 kB)RfassbindAdded years 1992-2003, GIMP animation intervall set to 1500ms
20:16 15 jun 2014Miniatura de la versión del 20:16 15 jun 2014332 × 348 (141 kB)RfassbindAdded years 2004-2007. Total timespan now 2004-2013
18:45 15 jun 2014Miniatura de la versión del 18:45 15 jun 2014332 × 348 (87 kB)RfassbindUser created page with UploadWizard

La siguiente página usa este archivo:

Uso global del archivo

Metadatos